mirror of
https://github.com/avinal/rstats-test.git
synced 2026-07-03 20:10:08 +05:30
rstats-test
Binary Segmentation Project tests
Easy
-
Download data(neuroblastoma, package=”neuroblastoma”) and plot profile.id=4, chromosome=2, (y=logratio, x=position).
total data points = 234
-
Use binsegRcpp to compute binary segmentation models up to 5 segments (change in mean, normal distribution), then plot those segment means and changepoints on top of the data.
S No. 1 2 3 4 5 6 Segment 1-41 42-113 114-146 147-152 153-157 158-234 Mean 0.351231083 0.005885206 -0.447813047 -0.307411681 -0.666259257 0.003035709 Changepoint 41 113 146 152 157 - 


Medium
-
Use the changepoint package to compute models up to 5 segments for the same data set.
S No. 1 2 3 4 5 6 Segment 1-41 42-113 114-152 153-157 158-220 220-234 Mean 0.351231083 0.005885206 -0.426212837 -0.666259257 0.016075375 -0.055642790 Changepoint 41 113 152 157 220 - -
Are the changepoints the same?
While most of the changepoints are same there are few variation, shown in table and in figure as blue box.
Package Changepoints binsegRcpp 41 113 146 152 157 changepoint 41 113 152 157 220 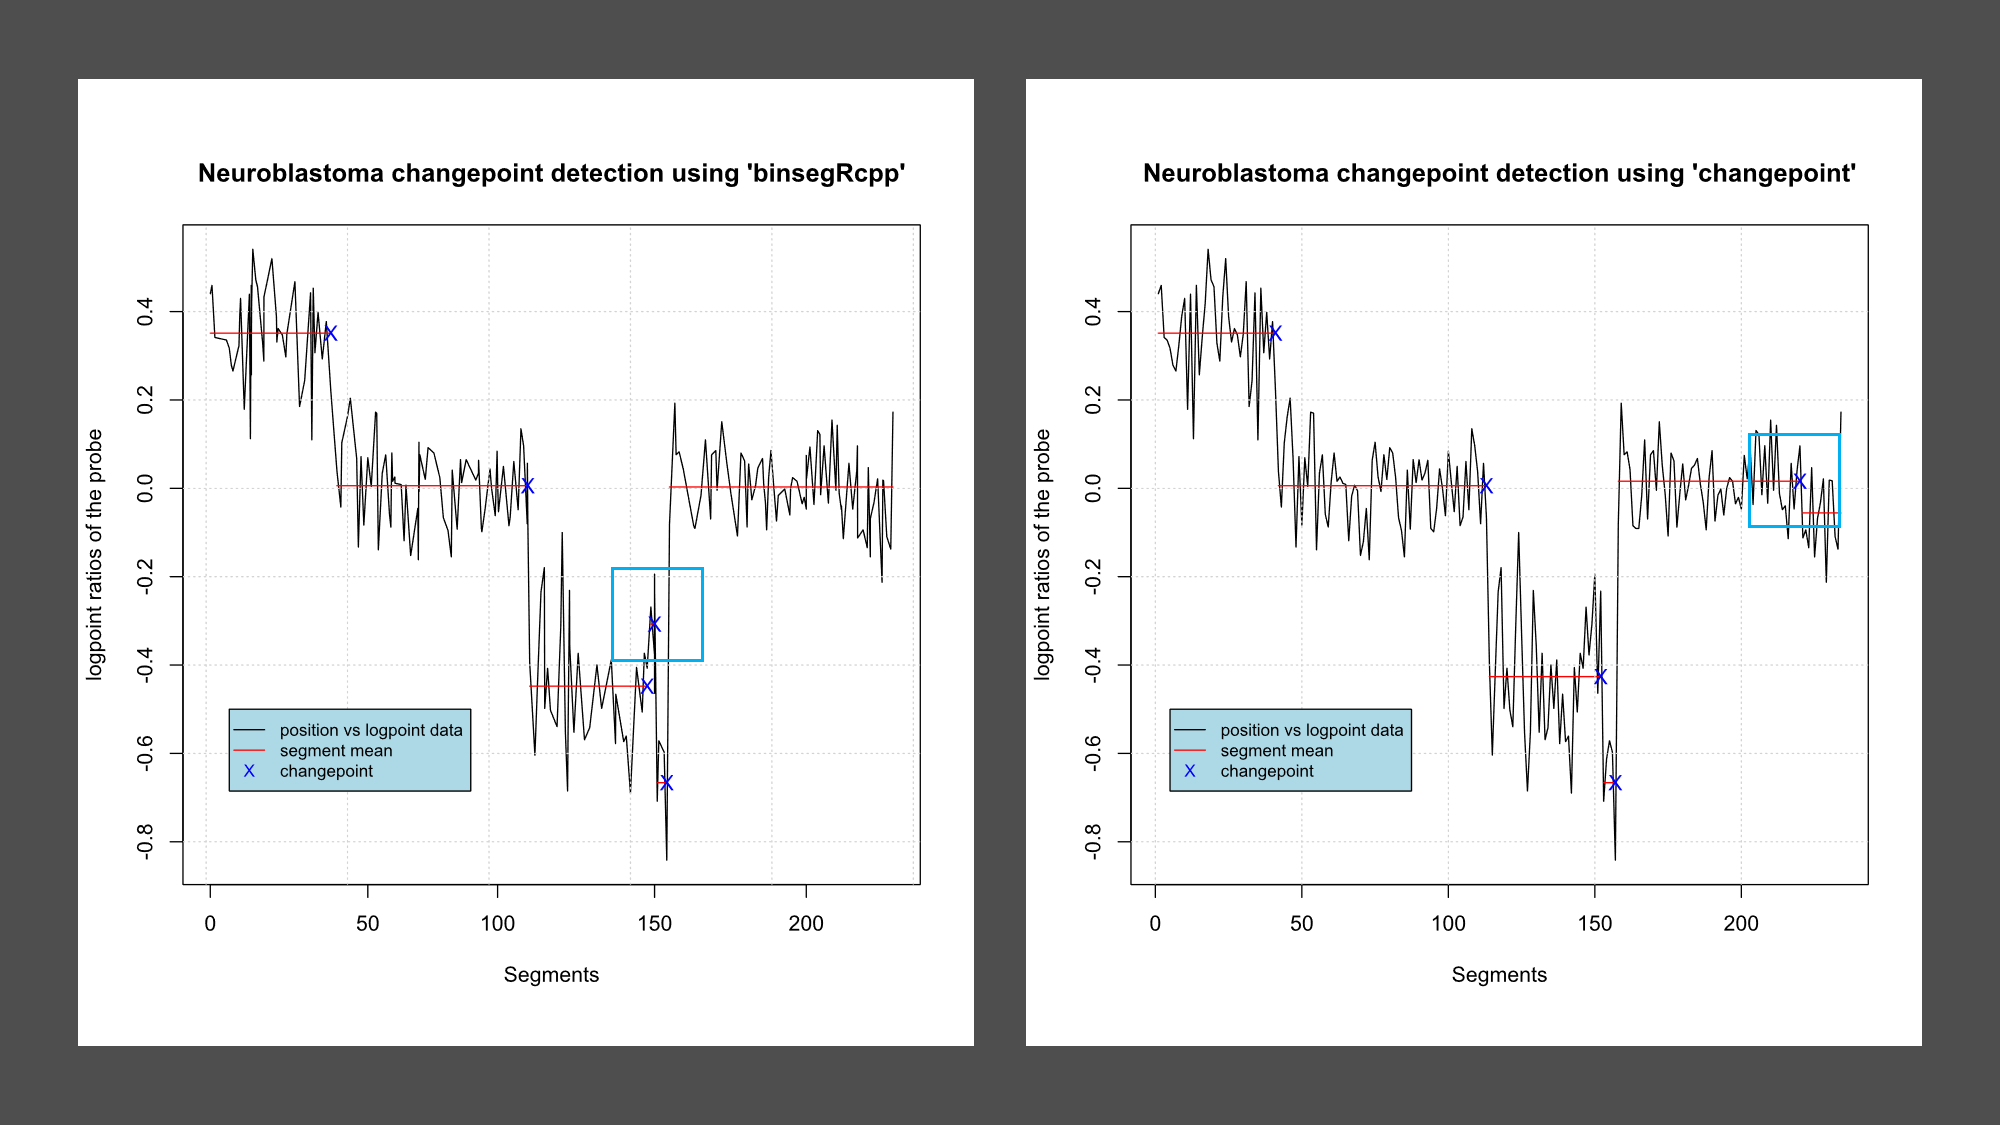

Hard 1
- Implement Negative Binomial loss function in C code using the same arguments as in changepoint/src/cost_general_functions.c.
Hard 2
- Fork binsegRcpp and modify src/binseg_normal.cpp so that it computes change in mean and variance (instead of change of mean with constant variance).
- Use it to compute changepoints for the same neuroblastoma data set, and verify that the result is the same as the result of
changepoint::cpt.meanvar.