# rstats-test
Binary Segmentation Project tests
## Easy
- Download data(*neuroblastoma*, package=”neuroblastoma”) and **plot profile.id=4**, **chromosome=2**, (**y=logratio**, ***x=position***).
```txt
total data points = 234
```
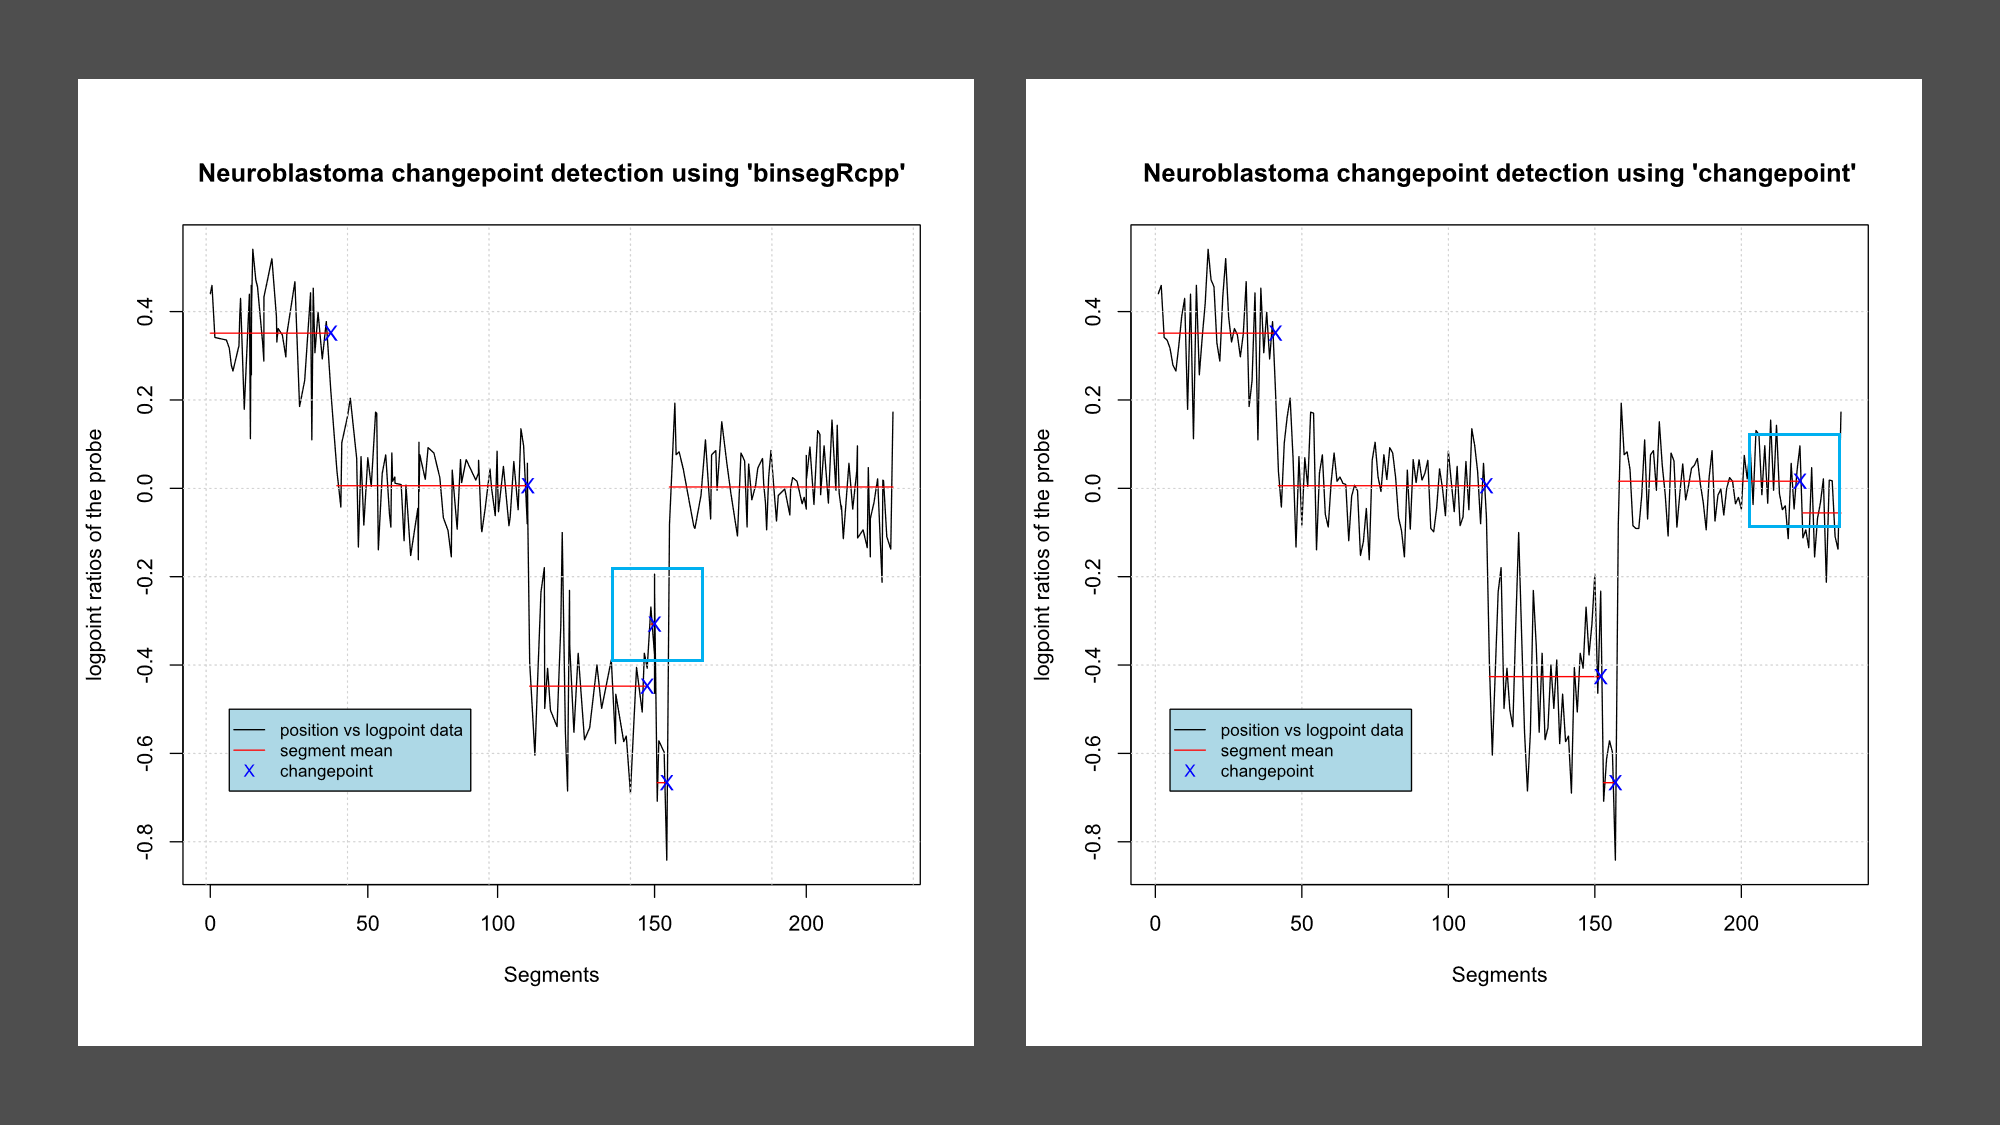
 - Use *binsegRcpp* to compute binary segmentation models up to 5 segments (change in mean, normal distribution), then plot those segment means and changepoints on top of the data.
| S No. | 1 | 2 | 3 | 4 | 5 | 6 |
| --- | --- | --- | --- | --- | --- | --- |
| Segment | 1-41 | 42-113 | 114-146 | 147-152 | 153-157 | 158-234 |
| Mean | 0.351231083 | 0.005885206 | -0.447813047 | -0.307411681 | -0.666259257 | 0.003035709 |
| Changepoint | 41 | 113 | 146 | 152 | 157 | - |
- Use *binsegRcpp* to compute binary segmentation models up to 5 segments (change in mean, normal distribution), then plot those segment means and changepoints on top of the data.
| S No. | 1 | 2 | 3 | 4 | 5 | 6 |
| --- | --- | --- | --- | --- | --- | --- |
| Segment | 1-41 | 42-113 | 114-146 | 147-152 | 153-157 | 158-234 |
| Mean | 0.351231083 | 0.005885206 | -0.447813047 | -0.307411681 | -0.666259257 | 0.003035709 |
| Changepoint | 41 | 113 | 146 | 152 | 157 | - |
 ## Medium
- Use the *changepoint* package to compute models up to 5 segments for the same data set.
| S No. | 1 | 2 | 3 | 4 | 5 | 6 |
| --- | --- | --- | --- | --- | --- | --- |
| Segment | 1-41 | 42-113 | 114-152 | 153-157 | 158-220 | 220-234 |
| Mean | 0.351231083 | 0.005885206 | -0.426212837 | -0.666259257 | 0.016075375 | -0.055642790
| Changepoint | 41 | 113 | 152 | 157 | 220 | - |
- Are the changepoints the same?
While most of the changepoints are same there are few variation, shown in table and in figure as blue box.
## Medium
- Use the *changepoint* package to compute models up to 5 segments for the same data set.
| S No. | 1 | 2 | 3 | 4 | 5 | 6 |
| --- | --- | --- | --- | --- | --- | --- |
| Segment | 1-41 | 42-113 | 114-152 | 153-157 | 158-220 | 220-234 |
| Mean | 0.351231083 | 0.005885206 | -0.426212837 | -0.666259257 | 0.016075375 | -0.055642790
| Changepoint | 41 | 113 | 152 | 157 | 220 | - |
- Are the changepoints the same?
While most of the changepoints are same there are few variation, shown in table and in figure as blue box.
| Package |
Changepoints |
| binsegRcpp |
41 |
113 |
146 |
152 |
157 |
| changepoint |
41 |
113 |
152 |
157 |
220 |
 ## Hard 1
- Implement Negative Binomial loss function in C code using the same arguments as in [changepoint/src/cost_general_functions.c]("https://github.com/rkillick/changepoint/blob/master/src/cost_general_functions.c").
## Hard 2
- Fork binsegRcpp and modify [src/binseg_normal.cpp]("https://github.com/tdhock/binsegRcpp/blob/master/src/binseg_normal.cpp") so that it computes change in mean and variance (instead of change of mean with constant variance).
- Use it to compute changepoints for the same neuroblastoma data set, and verify that the result is the same as the result of `changepoint::cpt.meanvar`.
## Hard 1
- Implement Negative Binomial loss function in C code using the same arguments as in [changepoint/src/cost_general_functions.c]("https://github.com/rkillick/changepoint/blob/master/src/cost_general_functions.c").
## Hard 2
- Fork binsegRcpp and modify [src/binseg_normal.cpp]("https://github.com/tdhock/binsegRcpp/blob/master/src/binseg_normal.cpp") so that it computes change in mean and variance (instead of change of mean with constant variance).
- Use it to compute changepoints for the same neuroblastoma data set, and verify that the result is the same as the result of `changepoint::cpt.meanvar`.